
Analyse Electricity Data in the Tools You Already Use
Volt Data Feeds connect directly to the platforms your team works with every day. From spreadsheets to dashboards to custom scripts. No manual exports, no stale data.
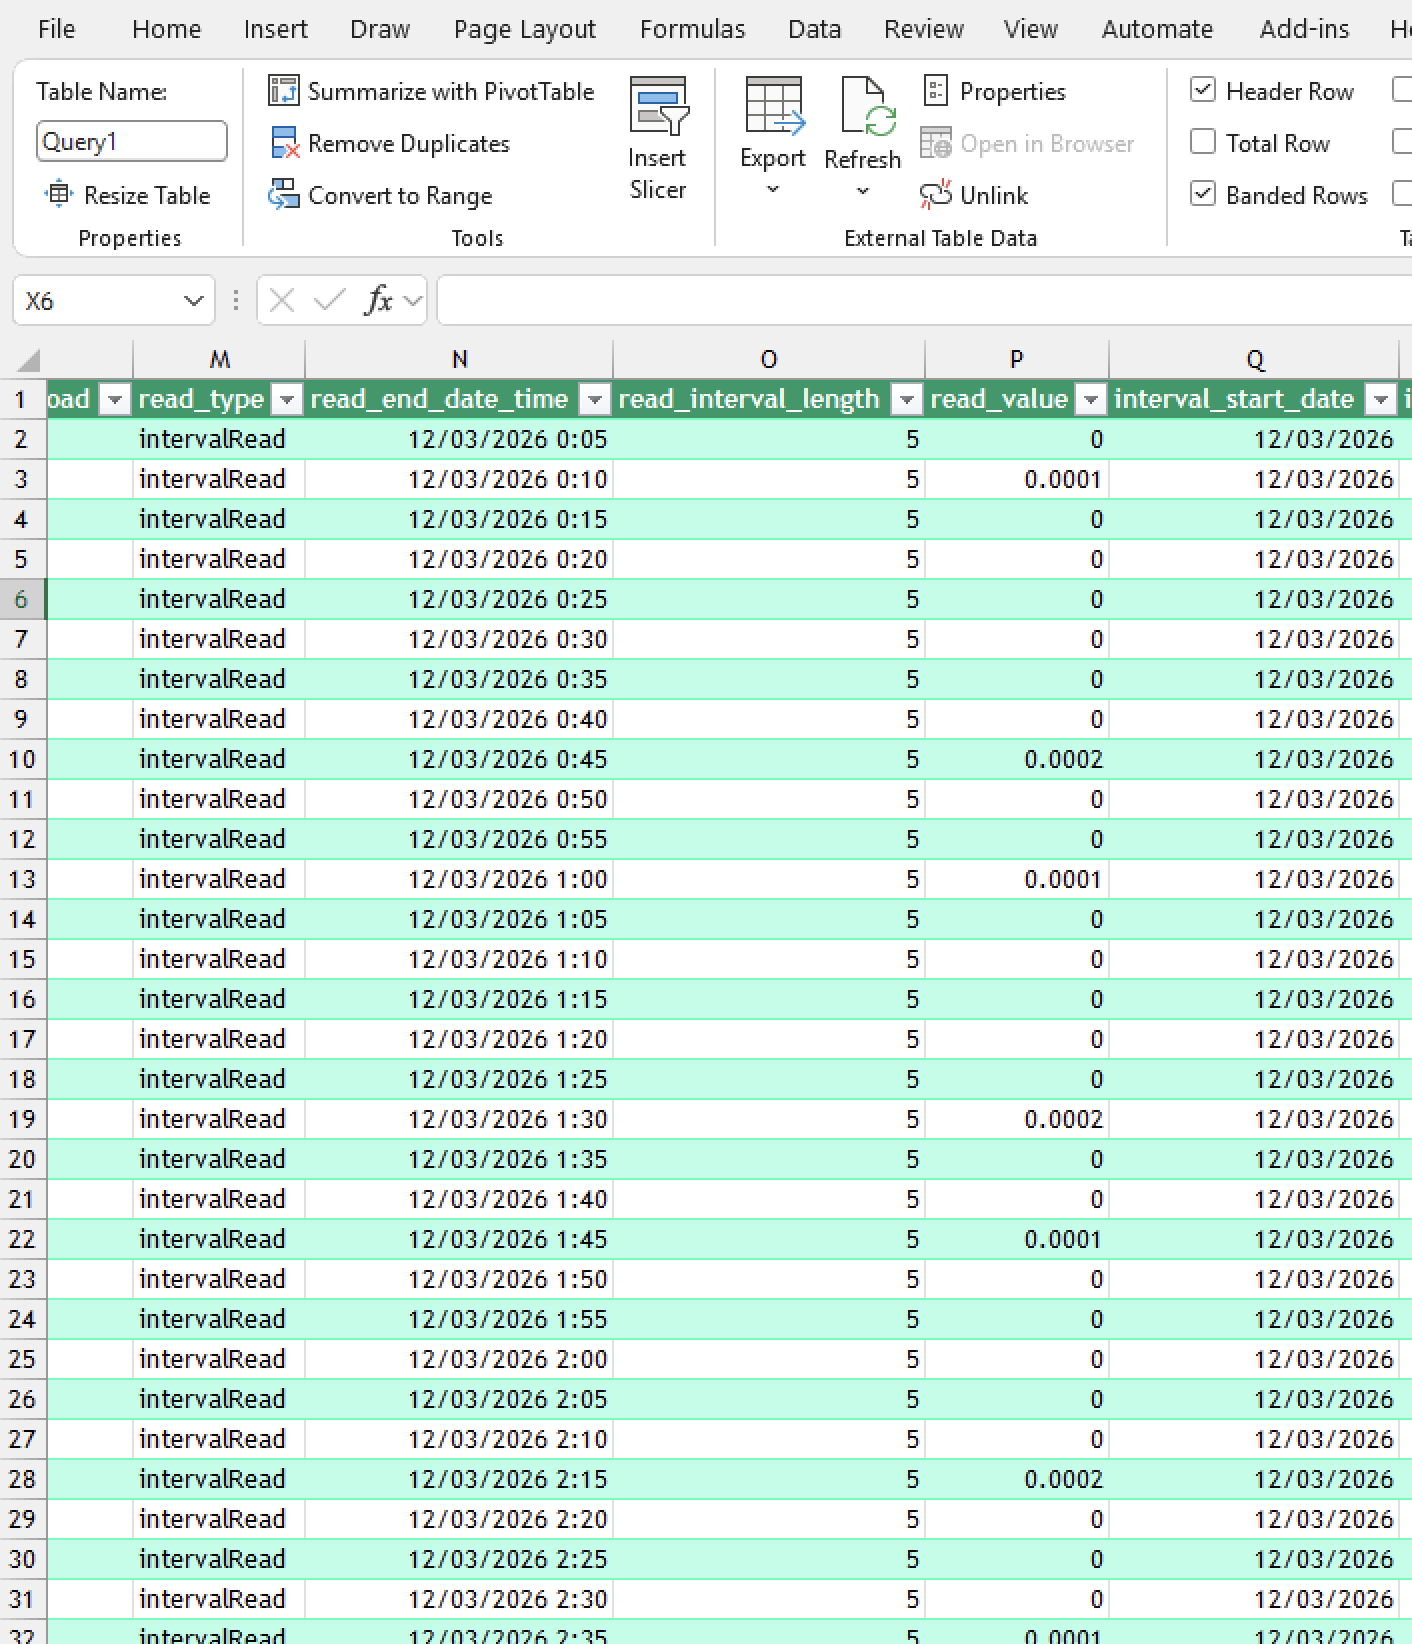
Microsoft Excel
Pull electricity data into Excel with our dedicated connector. Build custom reports, charts and models with familiar tools.
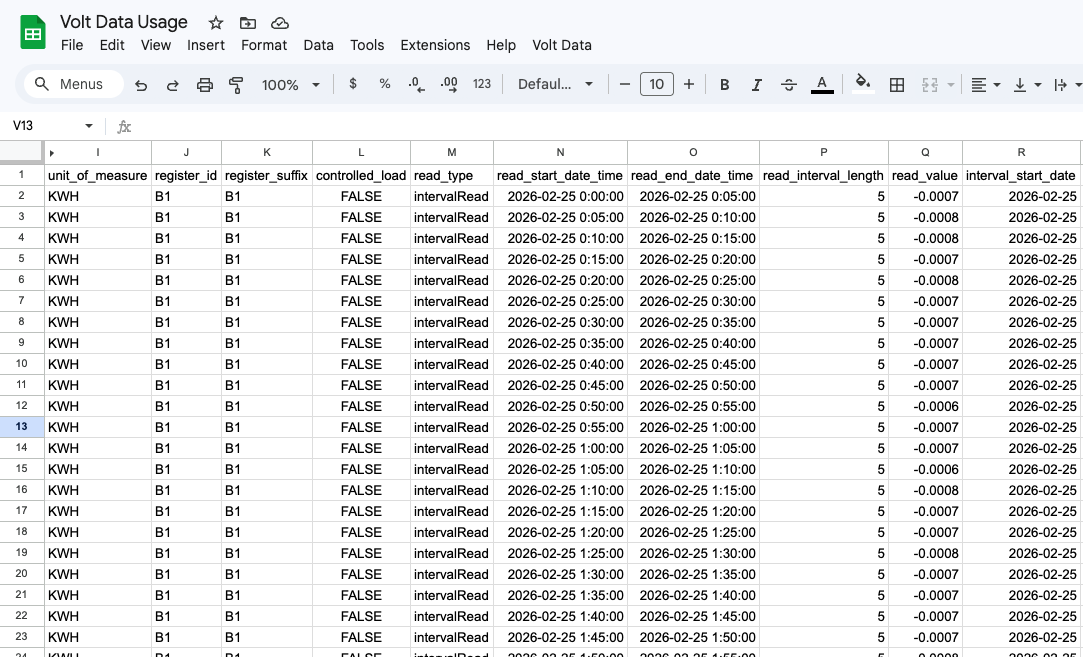
Google Sheets
Access your electricity data feeds directly in Google Sheets. Perfect for collaborative analysis and shared reporting.
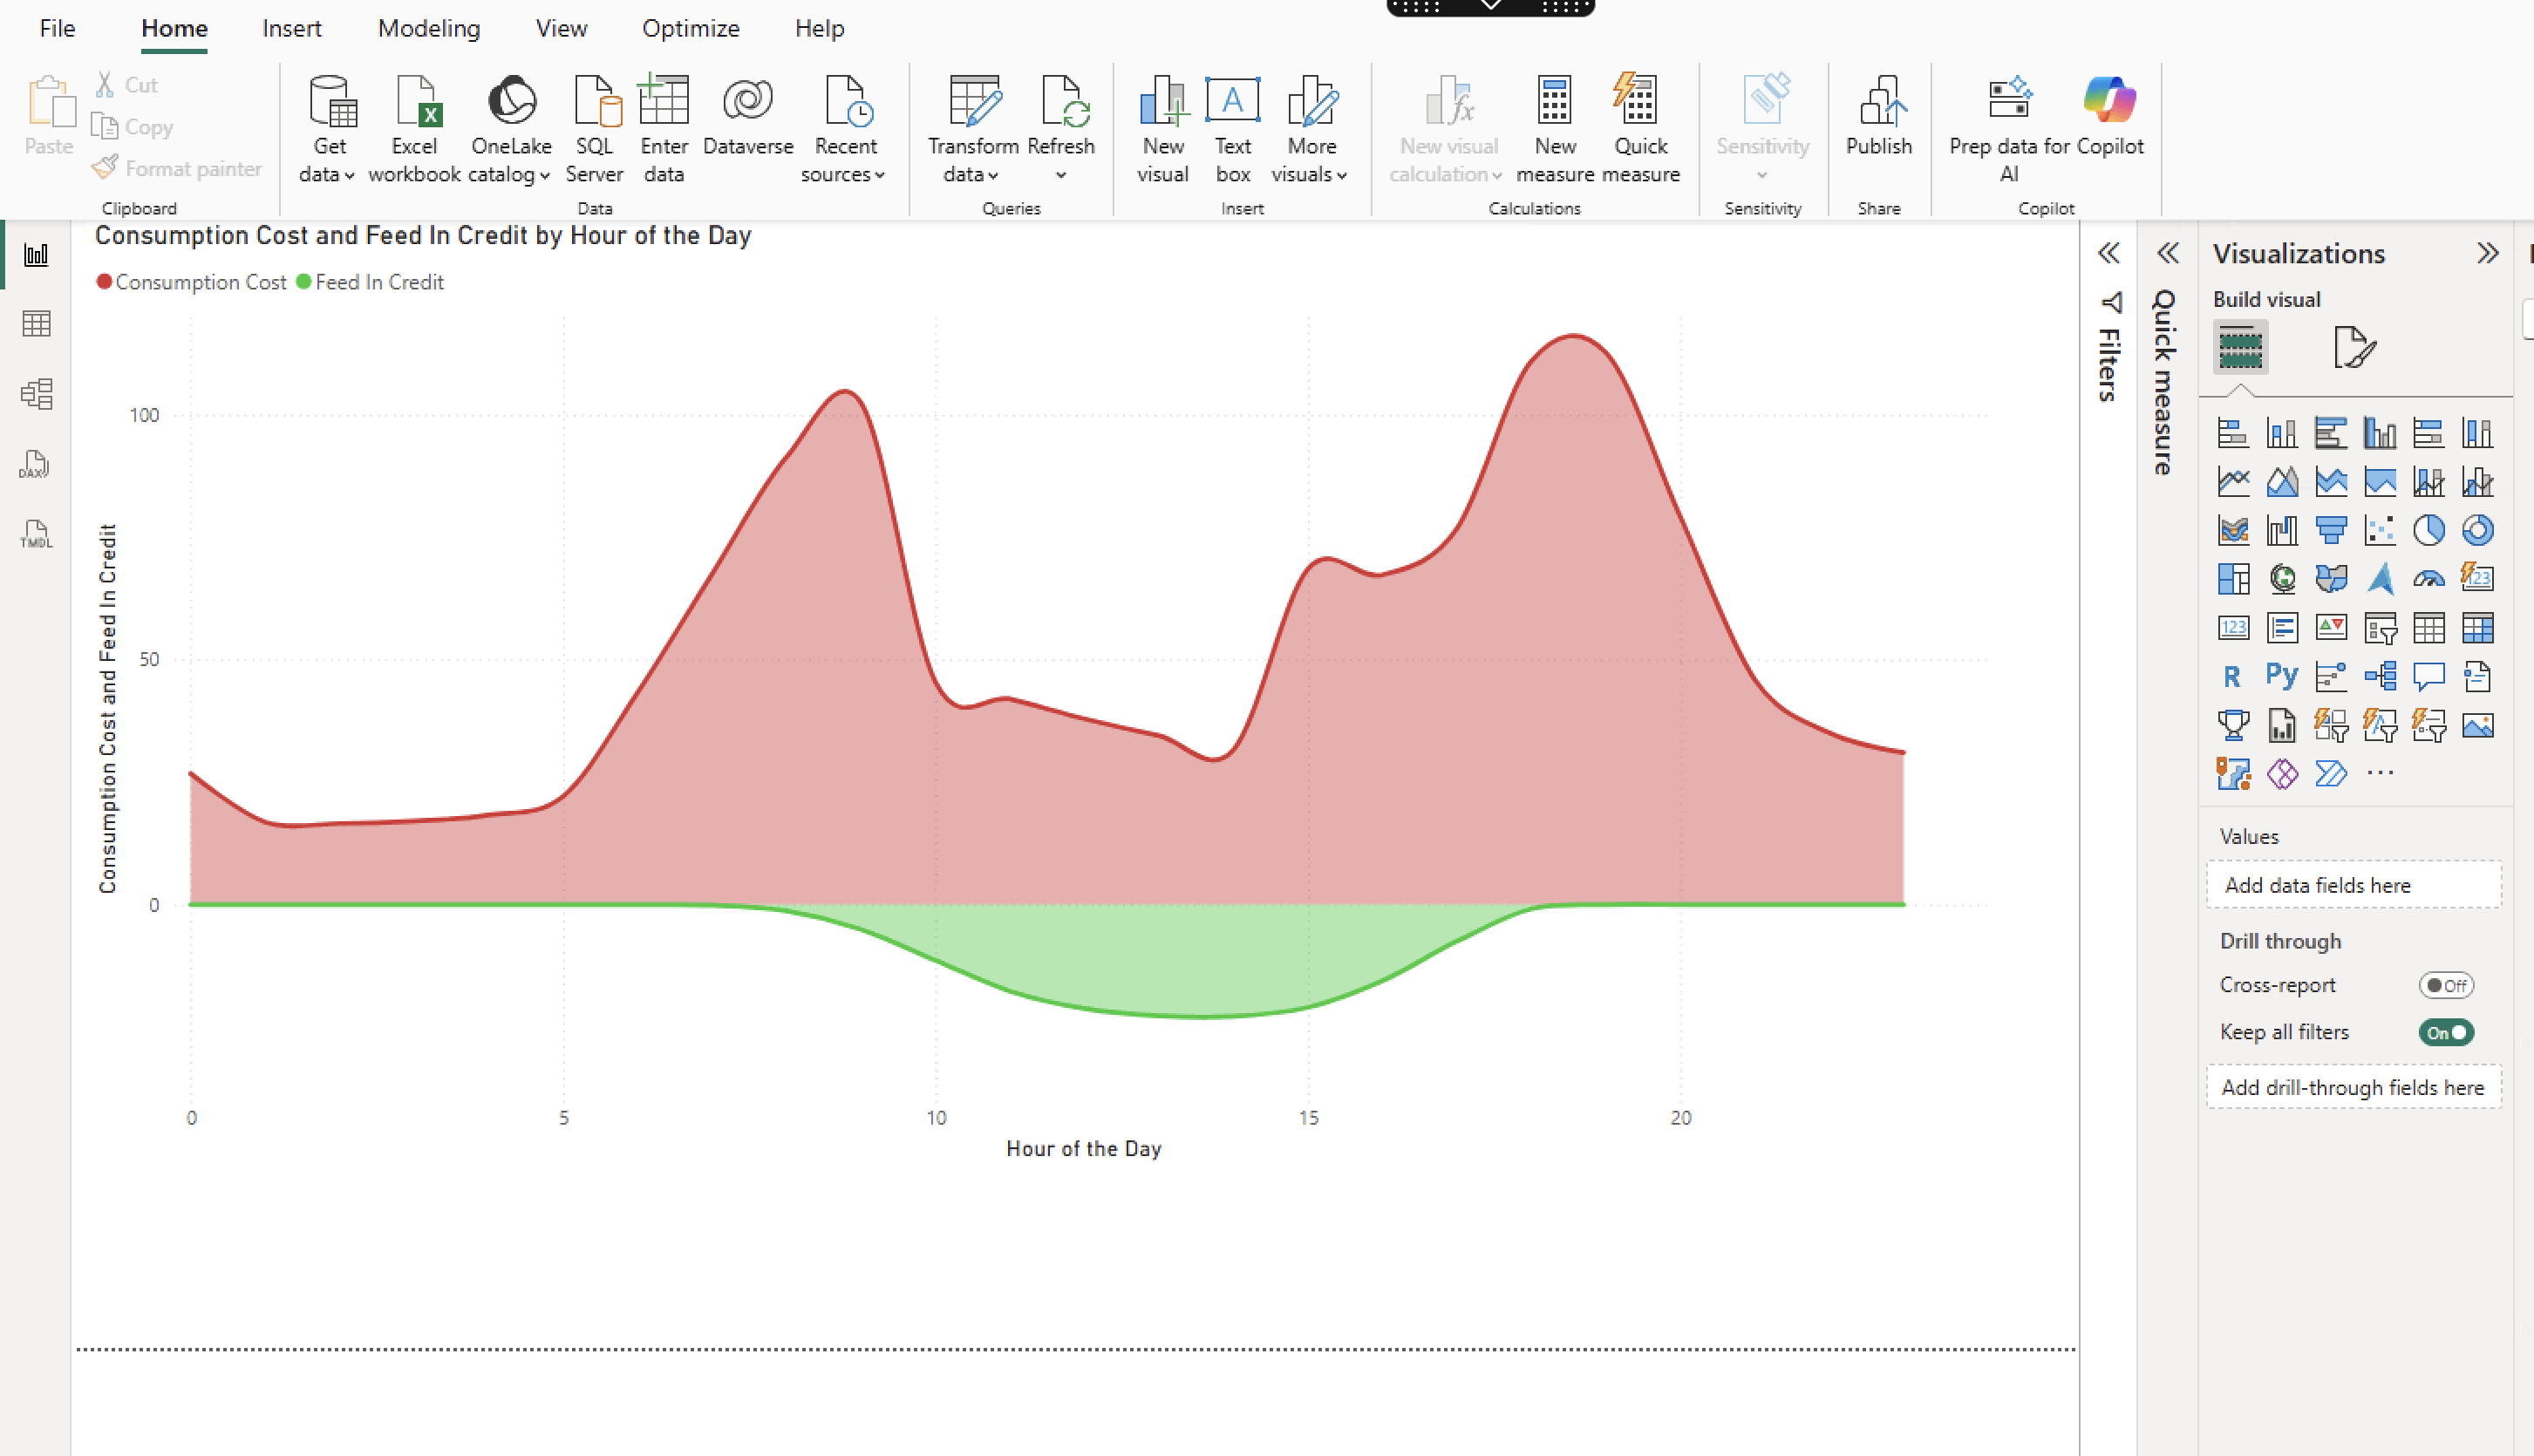
Power BI
Visualise electricity consumption, billing trends and portfolio metrics in rich Power BI dashboards with automated refreshes.
Python
Access raw data programmatically for custom analysis, machine learning models and automated data pipelines.
Your Analysis. Real Data.
Our connectors empower you to build your own insights and reports.
import requests
import pandas as pd
import io

# declare the url properties
base_url = "https://api.voltdata.com.au/data-feed/data/"
datafeed_id = __DATAFEED_ID__
datafeed_token = __DATAFEED_TOKEN__

# create the url
url = base_url + datafeed_id

# make the request
payload = {}
headers = {
  'Authorization': 'Bearer ' + datafeed_token
}
response = requests.request(
  "GET", url, headers=headers, data=payload
)

# Convert response to a DataFrame
df = pd.read_csv(io.StringIO(response.text))

# Print the DataFrame head
print(df.head())
Ready to Connect Your Data?
Get started with a Volt Data Feed and plug straight into the analysis and business intelligence the tools you already use.
Get In Touch